Individual Defensive Wins, Deeper Stat Dive: Notre Dame Vs. Florida State

Notre Dame’s rushing numbers are a sight to behold.
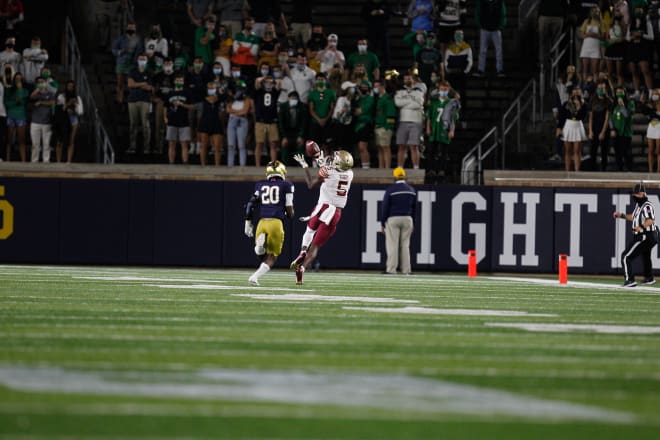
Notre Dame defeated Florida State 42-26 Saturday, behind 353 rushing yards and 8.4 yards per carry. Only four times since 2000 have the Irish averaged more yards per attempt on the ground. Running backs Kyren Williams and Chris Tyree combined for 288 yards.
Much more happened than a dominant ground game, though. Here’s a look.
Each week, I’ll compile a few stats you don’t see in the regular box score that can help paint a better picture of what really happened, why something happened and some individual stars.
First, BlueandGold.com’s custom stat: individual defensive wins, which measures the number of times a defensive player directly caused a failed play for the offense.
An individual defensive win (IDW) is when a defensive player registers any of the following: sack, tackle for loss, tackle for no gain, forced fumble, fumble recovery, interception, pass breakup, tackle that creates a third- or fourth-down stop and any tackle in a goal-to-go spot that results in the offense gaining 50 percent or less of the needed yardage. If both happened on one play, like a tackle for loss on third down, that counts as one IDW. Half-sacks, half-TFLs and half-stuffs count as a full IDW.
Here are the IDW leaders for Notre Dame against Florida State:

Jeremiah Owusu-Koramoah: 4 (2 TFL, 1 third-down stop, 0.5 stuff on third down)
Bo Bauer: 4 (2 third down stop, 1 sack on third down, 1 TFL in goal-line spot)
Ade Ogundeji: 3 (1 sack, 1 sack on third down, 0.5 stuff on third down)
Shaun Crawford: 3 (1 INT on third down, 1 PBU, 1 PBU on third down)
TaRiq Bracy: 3 (1 TFL, 1 PBU on third down, 1 goal-line tackle)
Nick McCloud: 2 (2 PBU)
Kyle Hamilton: 2 (2 third-down stops)
Justin Ademilola: 1 (stuff)
Kurt Hinish: 1 (TFL)
DJ Brown: 1 (PBU)
Daelin Hayes: 1 (stuff on third down)
Ovie Oghoufo: 1 (sack)
Here are the season IDW leaders:
9: Jeremiah Owusu-Koramoah
6: TaRiq Bracy, Ade Ogundeji
5: Kyle Hamilton, Drew White, Bo Bauer, Isaiah Foskey
4: Jack Kiser
3: Jacob Lacey, Myron Tagovailoa-Amosa, Kurt Hinish, Nick McCloud, Shaun Crawford
Deep Diving
Here’s how Notre Dame fared in college football data analyst Bill Connelly’s five factors. Those factors are:
If you win the explosiveness battle (using PPP), you win 86 percent of the time.
If you win the efficiency battle (using success rate), you win 83 percent of the time.
If you win the drive-finishing battle (using points per trip inside the 40), you win 75 percent of the time.
If you win the field position battle (average starting field position), you win 72 percent of the time.
If you win the turnover battle (turnover margin), you win 73 percent of the time.
I’m subbing yards per play for equivalence points per play (PPP) for explosiveness. Success rate is gaining 50 percent of the needed yards on first down, 75 percent on second down and 100 percent on third and fourth down.
Explosiveness (YPP): Florida State 5.7, Notre Dame 8.3
Efficiency (success rate): Florida State 40.3 (excluding last drive), Notre Dame 61.2
Drive-finishing (points per trip inside the 40): Florida State 4.33, Notre Dame 5.25
Field position: Notre Dame’s average starting field position was its own 28. Florida State’s was its own 29.
Turnover battle: Notre Dame committed two turnovers, while Florida State committed one. Notre Dame also missed a field goal and turned the ball over on downs, the latter in garbage time.
Other Notable Numbers
•Notre Dame’s havoc rate (percentage of defensive snaps that are a sack/TFL, pass breakup, interception or forced fumble) was 22.5 percent, its third straight game above 20. Anything in the 20s over the course of a season is usually enough to place in the national top 10.
•Notre Dame’s power success rate (third and short run conversion percentage) was 50 percent. The Irish had four such chances and converted two. They have faced 20 third or fourth downs with 3 or fewer yards needed and converted 14 of them. They have thrown the ball in those situations once – a drop by Joe Wilkins in the first half against Florida State
•Notre Dame sack-adjusted rushing total is the same as the final one, 42 carries for 353 yards. Taking out Ian Book’s three scrambles, Notre Dame ran for 336 yards on 39 carries.
•Season sack-adjusted rushing total: 126 carries, 826 yards (6.6 ypc)
•Notre Dame called 29 pass plays (including scrambles and a pass interference) and 39 runs.
----
• Talk about it inside Rockne’s Roundtable.
• Learn more about our print and digital publication, Blue & Gold Illustrated.
• Watch our videos and subscribe to our YouTube channel.
• Sign up for Blue & Gold's news alerts and daily newsletter.
• Subscribe to our podcast on Apple Podcasts.
• Follow us on Twitter: @BGINews, @BGI_LouSomogyi, @Rivals_Singer, @PatrickEngel_, @MasonPlummer_ and @AndrewMentock.
• Like us on Facebook.