Individual Defensive Wins And Deeper Stat Dive: Notre Dame Vs. Louisville

Maybe Brian Kelly was right, to an extent.
Asked postgame about the infrequent, low-scoring script that unfolded in Notre Dame’s 12-7 win over Louisville, he said an aesthetically unpleasing slopfest was an unfitting description.
“I've been in a 12-7 game when it was a stinker,” Kelly said. “You're like, ‘Eew. ‘But this game was a little different. It was hard-fought.”
The 89 percent Notre Dame postgame win expectancy backs him up. Notre Dame had problems in the red zone and lacked explosiveness, but this wasn’t a fluke outcome. The Irish earned the win, even if it wasn’t a modus operandi many wanted and was the fewest points they have scored in a win since 1990. A deeper look at the numbers confirms as much.
Each week, I’ll compile a few stats you don’t see in the regular box score that can help paint a better picture of what really happened, why something happened and some individual stars.
First, BlueandGold.com’s custom stat: individual defensive wins, which measures the number of times a defensive player directly caused a failed play for the offense.
An individual defensive win (IDW) is when a defensive player registers any of the following: sack, tackle for loss, tackle for no gain, forced fumble, fumble recovery, interception, pass breakup, tackle that creates a third- or fourth-down stop and any tackle in a goal-to-go spot that results in the offense gaining 50 percent or less of the needed yardage. If both happened on one play, like a tackle for loss on third down, that counts as one IDW. Half-sacks, half-TFLs and half-stuffs count as a full IDW.

Here are the IDW leaders for Notre Dame against Louisville:
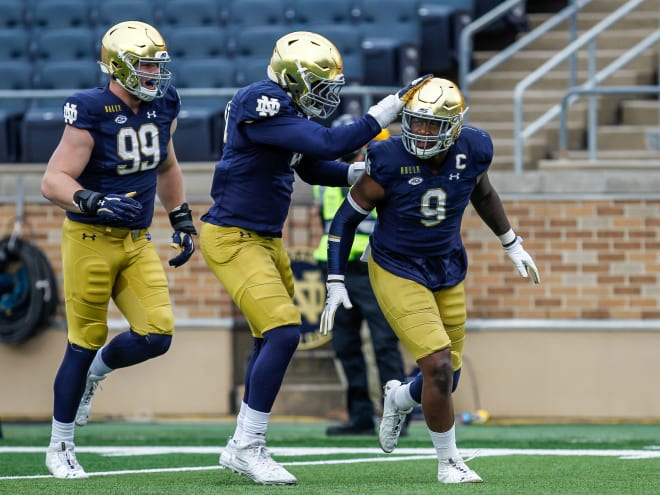
Jeremiah Owusu-Koramoah: 5 (2 TFL, 1.5 third-down stops, 1 stuff)
Shaun Crawford: 4 (1 TFL, 1.5 third-down stops, 1 PBU)
Kyle Hamilton: 2 (pass breakup on third down, third-down stop)
Howard Cross III: 1 (stuff)
Clarence Lewis: 1 (third-down stop)
Nick McCloud: (1 TFL)
Drew White: 1 (TFL)
Kurt Hinish: 1 (TFL)
TaRiq Bracy: 1 (1 TFL)
Daelin Hayes: 1 (TFL)
Marist Liufau: 1 (tackle for no gain)
Here are the season IDW leaders:
14: Jeremiah Owusu-Koramoah
8: Shaun Crawford
7: TaRiq Bracy, Kyle Hamilton
6: Ade Ogundeji, Drew White, Clarence Lewis
5: Bo Bauer, Isaiah Foskey
4: Jack Kiser, Nick McCloud, Kurt Hinish

Deep Diving
Here’s how Notre Dame fared in college football data analyst Bill Connelly’s five factors. Those factors are:
If you win the explosiveness battle (using PPP), you win 86 percent of the time.
If you win the efficiency battle (using success rate), you win 83 percent of the time.
If you win the drive-finishing battle (using points per trip inside the 40), you win 75 percent of the time.
If you win the field position battle (average starting field position), you win 72 percent of the time.
If you win the turnover battle (turnover margin), you win 73 percent of the time.
I’m subbing yards per play for equivalence points per play (PPP) for explosiveness. Success rate is gaining 50 percent of the needed yards on first down, 75 percent on second down and 100 percent on third and fourth down.
Explosiveness (YPP): Louisville 5.2, Notre Dame 5.2 (excluding kneel-downs)
Efficiency (success rate): Louisville 37 percent, Notre Dame 37 percent
Drive-finishing (points per trip inside the 40): Louisville 1.75, Notre Dame 2.4
Field position: Notre Dame’s average starting field position was its own 19. Louisville’s was its own 24.
Turnover battle: There were no turnovers. Louisville missed a field goal and Notre Dame failed on a fake field goal try.
Other Notable Numbers
Notre Dame’s havoc rate (percentage of defensive snaps that are a sack/TFL, pass breakup, interception or forced fumble) was 22.2 percent, its fourth straight game above 20. Anything in the 20s over the course of a season is usually enough to place in the national top 10. Louisville’s havoc rate was 14.7 percent.
Notre Dame’s power success rate (third and short run conversion percentage) was 100 percent, or 2-for-2. This season, Irish have faced 22 third or fourth downs with 3 or fewer yards needed and converted 16 of them (73 percent). They have thrown the ball in those situations once – a drop by Joe Wilkins Jr. in the first half against Florida State. An Ian Book 20-yard scramble on third-and-3 against Louisville, though, was a designed pass play.
Notre Dame sack-adjusted and kneel-down adjusted rushing total is 43 carries for 260 yards (6.0 yards per carry). Removing Ian Book’s five scrambles (for 41 yards) that were initially pass plays and the fake field goal, Notre Dame ran for 212 yards on 37 carries (5.73 ypc).
Season sack-adjusted rushing total: 169 carries, 1,115 yards (6.6 ypc).
Excluding two kneel-downs, the fake field goal and counting nine sacks and scrambles as designed passes, Notre Dame called 37 runs and 28 passes.

----
• Learn more about our print and digital publication, Blue & Gold Illustrated.
• Watch our videos and subscribe to our YouTube channel.
• Sign up for Blue & Gold's news alerts and daily newsletter.
• Subscribe to our podcast on Apple Podcasts.
• Follow us on Twitter: @BGINews, @BGI_LouSomogyi, @Rivals_Singer, @PatrickEngel_, @MasonPlummer_ and @AndrewMentock.
• Like us on Facebook.